How to Use Infographics on Websites Effectively to Attract Maximum Traffic
In the world of cutthroat competition, online businesses look to do everything to make your website surge ahead in the competition. Neglecting website design is one of the most common mistakes small businesses make.
Your website is often the first interaction potential customers have with your brand, so making a good impression is paramount. Various Studies show that more than 90% of site visitors’ fees are affected by the design of a site. Moreover. Over 35% of people will stop engaging with a site if its content/layout is unattractive.
So, how do you make it trendy and attractive, and how to use infographics on websites? This blog will shed light on it comprehensively. Let’s begin.
Let's Look at What an Infographic is And Why it is Important?

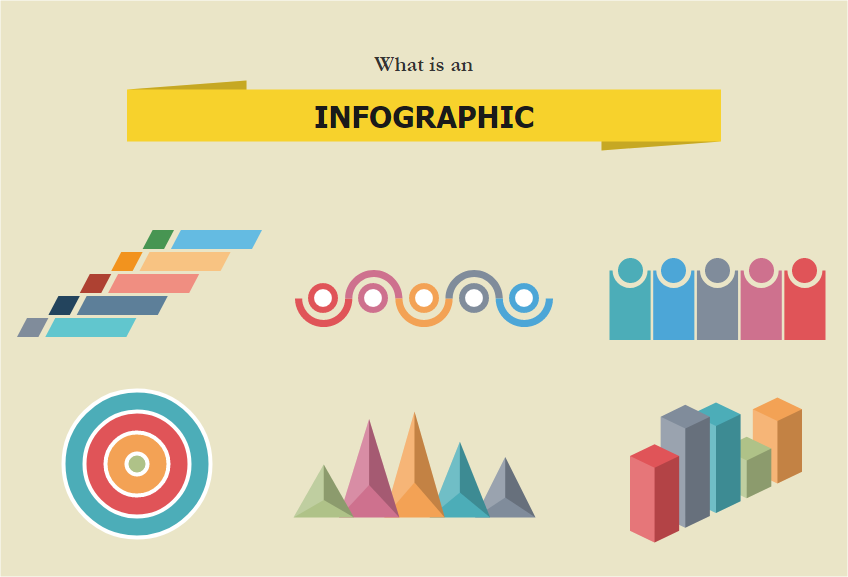
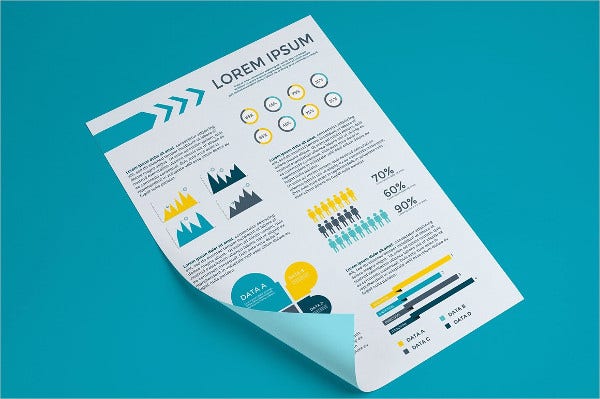
An infographic visually represents information, data, or knowledge and is a great way to convey complex ideas quickly and easily while making your website more appealing.
They are created to present information in a way that is both visually appealing and easy to understand for onlookers. They are often used on websites, social media, and communication mediums to communicate complex data or topics in a more digestible format.
In a nutshell, infographics on websites serve a variety of purposes, such as:
– Increasing website traffic
-Generating leads and sales
– Boosting SEO
– Enhancing brand awareness
The above points show infographics can be very helpful in increasing the traffic and time people dwell on your website.
When users find an infographic that makes them understand complex information visually, they like the page. With increasing clicks, the site’s web page signals to Google that it is worthy of getting a higher rank, so the ranking shoots up, and traffic increases too.
Another way they help SEO is that they often contain keywords and phrases that can help improve your rankings in search engines. Moreover, infographics are one of the best ways to establish yourself as an authority in your industry or niched. They can help show potential customers and clients that you know what you’re talking about and make an instant impression.
Steps to Create Engaging Infographics

We have discussed that creating and using infographics is a great way to add interest and visual appeal to your web page; you can present data, create visual stories, or add visual interest to your site. No matter how you use them, be sure to choose an infographic design that is visually appealing and easy to understand.
Creating an infographic is all about organizing the visuals around the data. Here’s a quick overview of how to create an infographic:
- Choose a topic.
- Do your research, and gather and organize your data.
- Finding the right design for your infographic and Customize your infographic
- Start with a headline and brief introduction (optional).
- Add in all of your graphics and text, grouped into categories.
- Include a CTA at the bottom, asking viewers to take action (such as signing up for your email newsletter or viewing another page on your site).
- Embed your infographic onto your website or blog.
- Publish your infographic.
- Share your infographic on social media using social sharing buttons.
By following these steps, you’ll be able to create an engaging and informative infographic that will reach a wide audience.
How to Create a Winning Design to Create Impactful Infographics
Design is a critical part of creating an infographic. The right design will help your infographic stand out, communicate your message clearly, and leave a lasting impression on your audience.
There are a few things to keep in mind when you’re designing your infographic.
- Don’t make it complex: When it comes to infographics, less is always more. Offering too much information will only overwhelm your readers and make your infographic less effective. Focus on keeping your message simple and direct while staying true to the basics. Put yourself in the shoes of a layman and judge if they will understand and relate to it.
- Make it visually rich: An infographic is only as good at making an impact as its design. Be sure to use high-quality images and graphics that are eye-catching and relevant to your topic. Most importantly, be creative as possible, and stealing someone else completely a big no.
Here are a few considerations for you when you create your infographics:
- The infographic’s headline should clearly state what it is about, so make sure to use clear and concise language.
- Ensure that the infographic is easy to read and understand. You should use visuals, such as charts, graphs, and illustrations, to help explain the data and information.
- Make sure that the infographic is visually appealing. This means using a color palette that is attractive and pleasing to the eye.
- Choose fonts that are easy to read and the visuals are well-spaced and balanced.
- Use data wisely: Too much data can make your infographic difficult to understand. Use data wisely and only include the most important and relevant information.
- Tell a story: A good infographic should tell a story to your visitors to keep them engaged. Use your data and visuals to create a narrative that will engage your readers and leave a lasting impression.
- Keep it updated: An outdated infographic is never a good representation of your brand. Therefore, resist your previously published infographics, and make changes if you feel they have inaccurate data or are irrelevant. Even delete them if needed since you want your infographics to spread positivity about your business, not negativity.
How to embed Your Infographics on Websites
If you’re looking to get your infographic seen by as many people as possible, then you need to ensure you’re embedding it onto your website.
But why is this so important? By doing this, you’re increasing the chances that people will see your infographic and be able to share it with their own audiences.
Additionally, when you embed your infographic on our website, you’re also helping to build backlinks to your site. This is good for your SEO and can help increase your website’s ranking in search engines.
If you want to add an infographic to your website, you can use a few different methods. One method is to host the infographic on your own website and then embed it on the page where you want it to appear. This is a good option if you have a website with plenty of storage space.
Another method is hosting the infographic on a third-party website and then embedding the code onto your website. This is a good option if you don’t have a lot of storage space on your website.
Another option is to write a blog post to accompany the infographic. This can increase its reach and visibility and provide context and additional information that readers may find helpful.
Writing a blog post to showcase your infographic is easy and effective and can be an excellent way to get more eyes on your content.
Share the infographic together with social sharing buttons and embed links.
As you create and publish your infographic, keep social media in mind. You should also share your infographic on your social media channels to promote it and get it in front of as many people as possible.
An infographic is a great way to engage with your audience on social media and get your content seen by a wider audience. But for people to share your infographic, you need to make it easy for them to do so.
Include social sharing buttons on your infographic so people can share it with their followers with just a few clicks. Moreover, purposefully share your infographic across all your social media accounts, along with a link to the web page where it can be found. By following these tips, you can ensure that your infographic gets seen by those who need it.
Additionally, when you create an infographic, you want to make sure that it looks great no matter where it’s shared. That’s why it’s important to follow the image size guidelines for each social media platform.
Here are the image size guidelines for the most popular social media platforms:
Facebook: 1200 x 630 pixels
Twitter: 1024 x 512 pixels
LinkedIn: 700 x 400 pixels
Pinterest: 600 x 900 pixels
Keep these image size guidelines in mind when you create your next infographic, and you’ll be sure to have a social media-friendly design.
What Are the Best Tools to Create and Use Infographics on Websites?
Even though Photoshop is widely regarded as the best tool for creating incredible artwork, the market is flooded with some simple tools, such as:
- Visme
- Venngage
- Canva
- Easel.ly
- Infogram
- Genial.ly
Conclusion
This blog post discusses the benefits of adding infographics to your website. High-quality, eye-catching, relevant, and easy-to-understand infographics can improve your site’s design and engagement.
It touches on when creating an infographic keep the data front and center. Your design should revolve around the information. Start with a headline and, if necessary, a brief introduction. Then add all your images and graphics, group text, and icons to make the information easier to digest. Finally, add a CTA at the bottom of the infographic, asking viewers to take a specific action.
After you create your infographic, post it on your website or blog and on social media using hashtags and sharing buttons. And more importantly, add an embed code so others can easily share your infographic on their own site.


